https://www.theigc.org/reader/housing-finance/economics-subsidies-supply-demand-diagrams/
The economics of subsidies: Supply and demand diagrams
The effect of demand and supply-side subsidies on the housing market can be analysed through supply and demand graphs. This analysis illustrates that in the presence of an inelastic supply curve that prevents supply from responding to price rises, both subsidies are at best ineffective, and at worst a hand-out to developers.
1. Demand-side subsidies

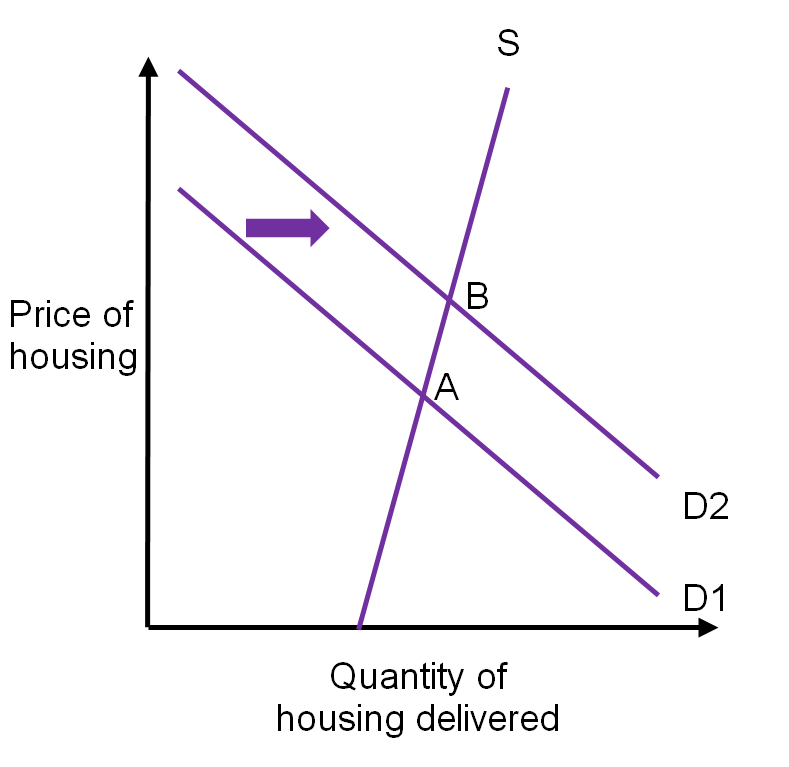
When housing providers are unable to respond to price rises by supplying more housing (e.g. due to a limited supply of well-connected land), the supply curve S rises upwards steeply. This is referred to as an inelastic supply response to price rises.
When a demand-side subsidy acts to shift the demand curve from D1 to D2, the housing market equilibrium moves from point A to point B. The main effect of the demand-side subsidy is therefore an increase in price rather than an increase in the quantity of housing delivered. The price rise translates into increased profits for housing suppliers.
2. Supply-side subsidies

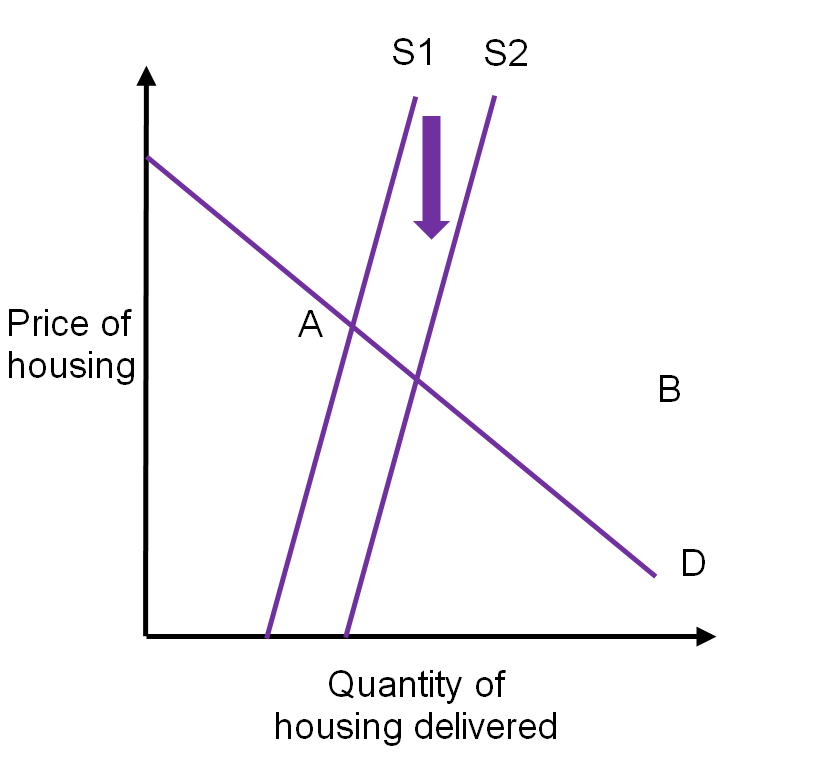
When a supply-side subsidy acts to reduce the price at which subsidised suppliers are willing to provide a certain quantity of housing, this shifts the supply curve downwards from S1 to S2. The housing market equilibrium moves from A to B, resulting in a decrease in price and increase in quantity delivered.
However, if the supply curve is inelastic as some inputs into housing production are relatively fixed in quantity (e.g. land) then these subsidies do not increase the total housing stock but rather serve to crowd out unsubsidised suppliers with subsidised suppliers. In the extreme case where the supply of land is completely fixed, the supply curve is vertical. The subsidy therefore has no effect on quantity, and simply serves to displace non-subsidised housing production.
3. Increasing supply elasticity

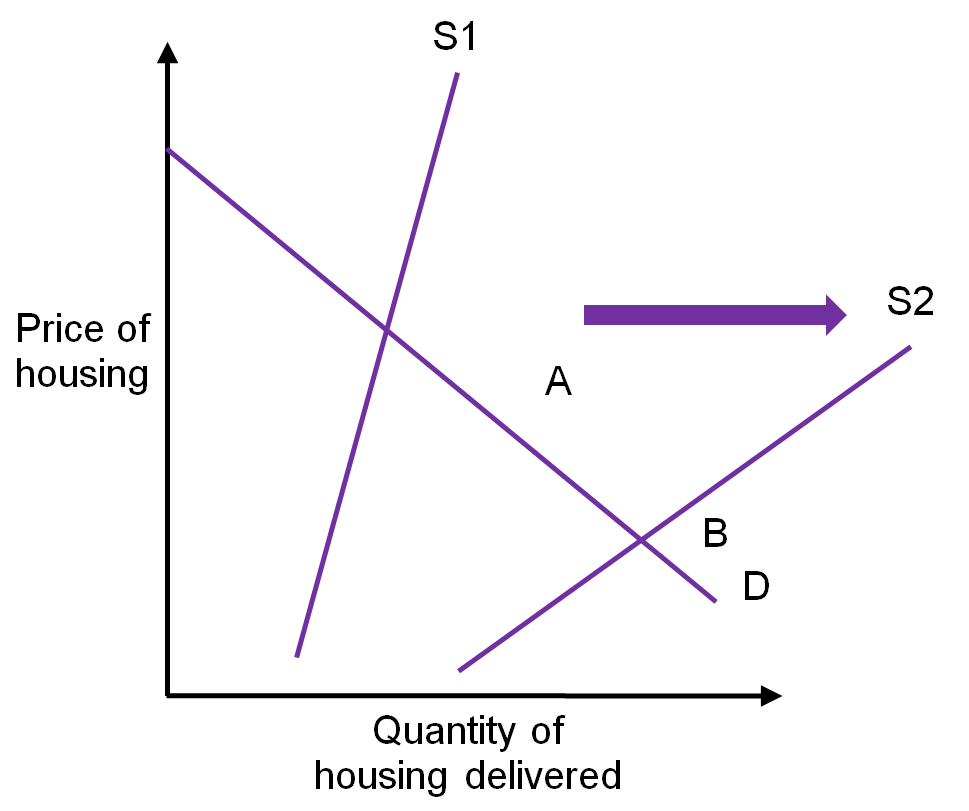
When policy acts to increase the elasticity of housing supply (e.g. through reforming land-use regulation or increasing the effective land supply) this enables the private sector to better respond to rises in price by supplying more housing in the market. This makes slope of the supply curve less steep such that the supply curve pivots from S1 to S2.
This movement in the supply curve reduces house prices and increases the quantity of housing delivered. It also has the corollary of making both demand and supply-side subsidies more effective if implemented.
No comments:
Post a Comment